Ever stared at a stock chart and felt like you’re decoding an alien language?  Don’t worry, you’re not alone! Stock charts are like the heartbeat of the market, packed with clues about where prices might head next. For novice traders, they’re your ticket to making smarter trades (and maybe impressing your friends with your “chart wizard” skills). In this blog, we’ll break down candlestick patterns, trends, volume analysis, and moving averages with a dash of humor to keep it fun. Plus, we’ll explore tools like TradingView and Zerodha Kite to make charting as easy as scrolling through memes. Ready to dive in? Let’s turn those squiggly lines into your new BFF!
Don’t worry, you’re not alone! Stock charts are like the heartbeat of the market, packed with clues about where prices might head next. For novice traders, they’re your ticket to making smarter trades (and maybe impressing your friends with your “chart wizard” skills). In this blog, we’ll break down candlestick patterns, trends, volume analysis, and moving averages with a dash of humor to keep it fun. Plus, we’ll explore tools like TradingView and Zerodha Kite to make charting as easy as scrolling through memes. Ready to dive in? Let’s turn those squiggly lines into your new BFF! 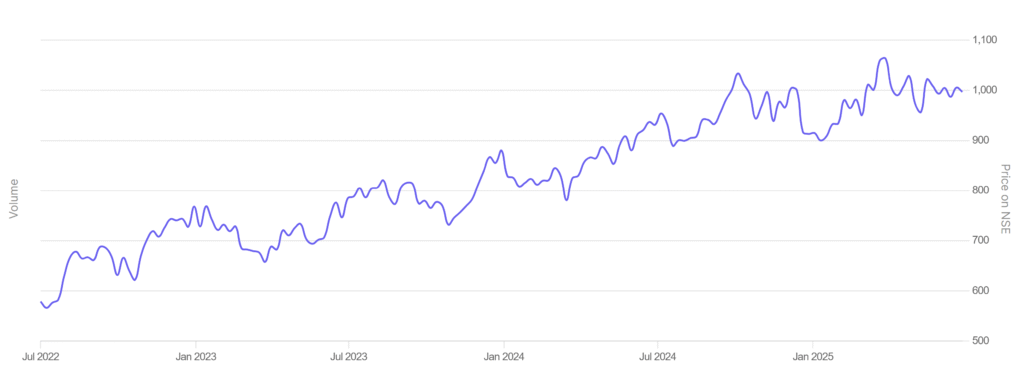
Picture a stock chart as a movie about a stock’s price journey. The x-axis is the timeline (days, hours, or even minutes), and the y-axis is the price, bouncing around like it’s auditioning for a Bollywood dance number.  Charts help you spot patterns, predict price moves, and decide whether to buy, sell, or just sip coffee and watch.
Charts help you spot patterns, predict price moves, and decide whether to buy, sell, or just sip coffee and watch.There are three main chart types:
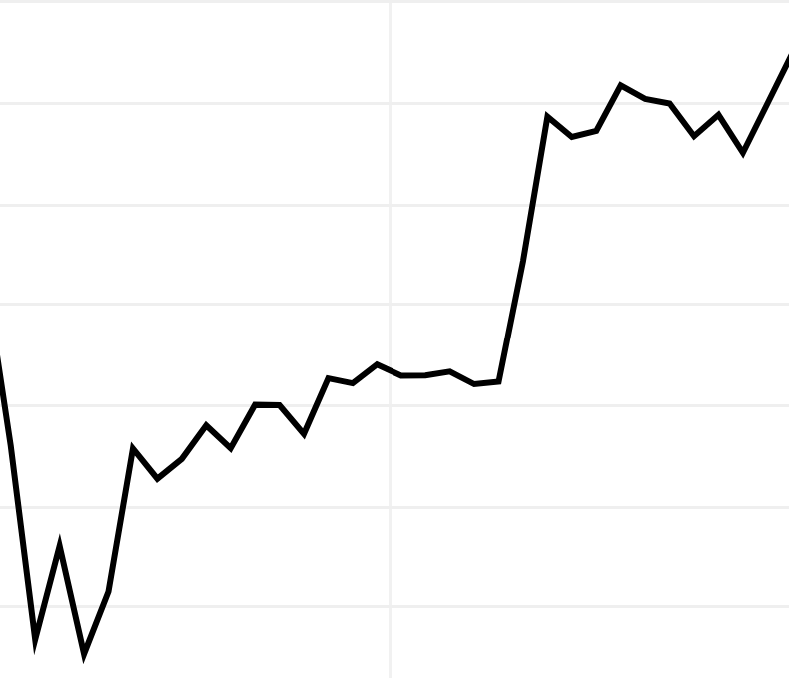
- Line Chart: A single line tracking closing prices. Simple, but it’s like reading a book with only the last page.
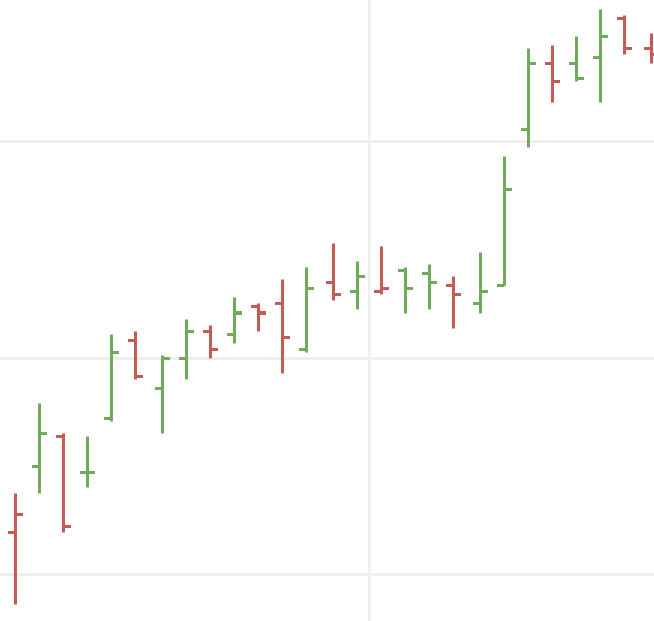
- Bar Chart: Shows open, high, low, and close (OHLC) prices with bars. More info, but looks like a barcode from a sci-fi flick.
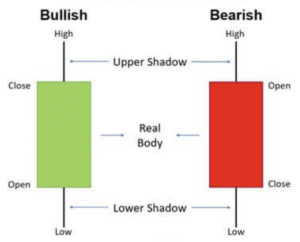
- Candlestick Chart: The rockstar of charts, showing OHLC in a colorful, candle-like format. It’s like a soap opera—full of drama and easy to get hooked!
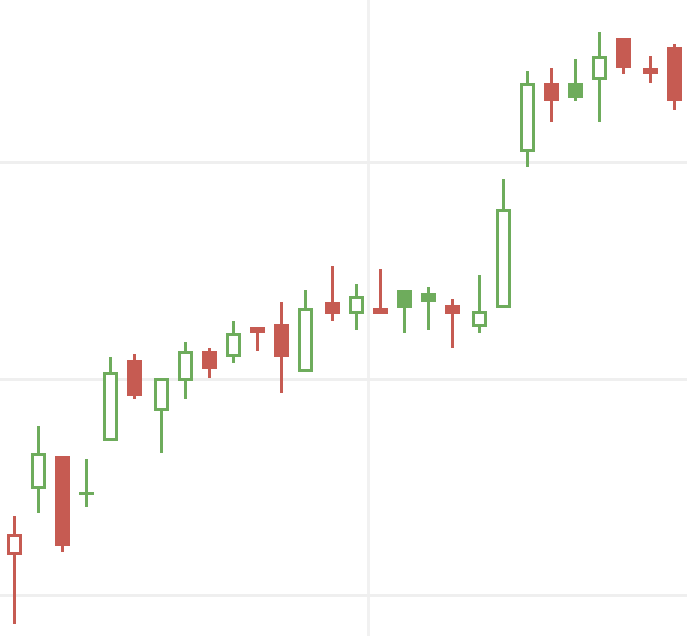
For beginners, candlestick charts are where the party’s at. They’re visual, fun, and packed with secrets. Let’s light up those candles! 
Quick Challenge: Open a free TradingView account and pick a stock (like Reliance or Tesla). Can you spot a green vs. red candle? Share your find in the comments!
These patterns are like plot twists in a thriller—they hint at what’s coming next. Here’s your beginner’s cheat sheet:
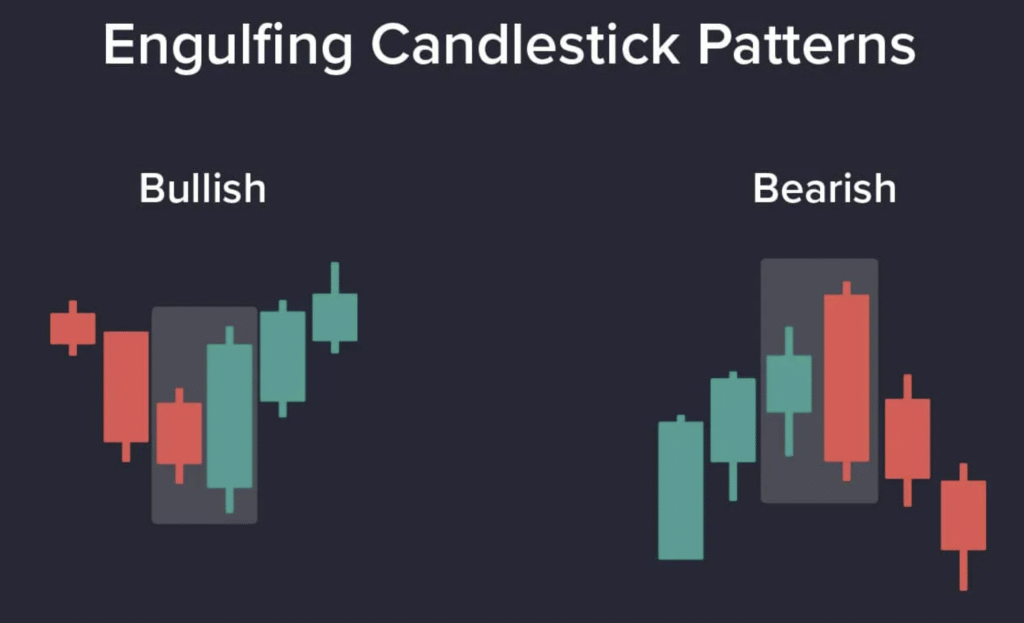
- Bullish Engulfing: A tiny red candle gets swallowed by a big green one. It’s like the underdog hero taking over, signaling prices might climb.

- Example: Stock’s been falling, then BAM—a bullish engulfing at a support level. Time to perk up!
- Bearish Engulfing: A small green candle gets eaten by a giant red one. Sellers are back with a vengeance, hinting at a drop.

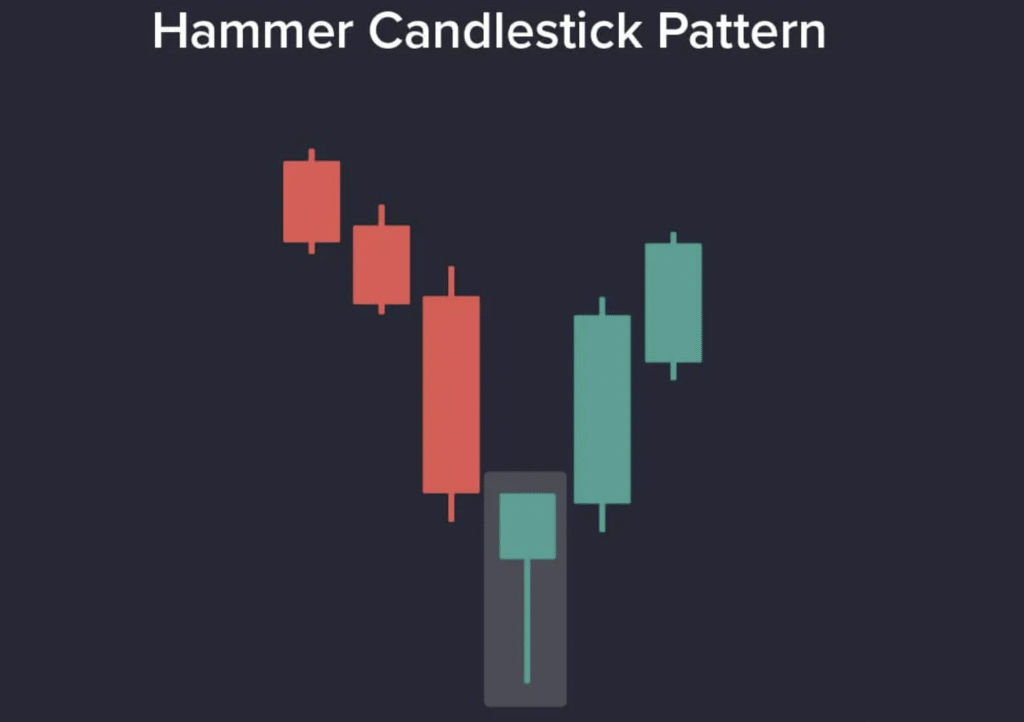
- Hammer: A small body with a long lower wick after a downtrend. Buyers swooped in like superheroes, pushing the price up. Possible reversal alert!

- Pro Tip: A hammer with high volume is like a superhero with a megaphone—louder signal!
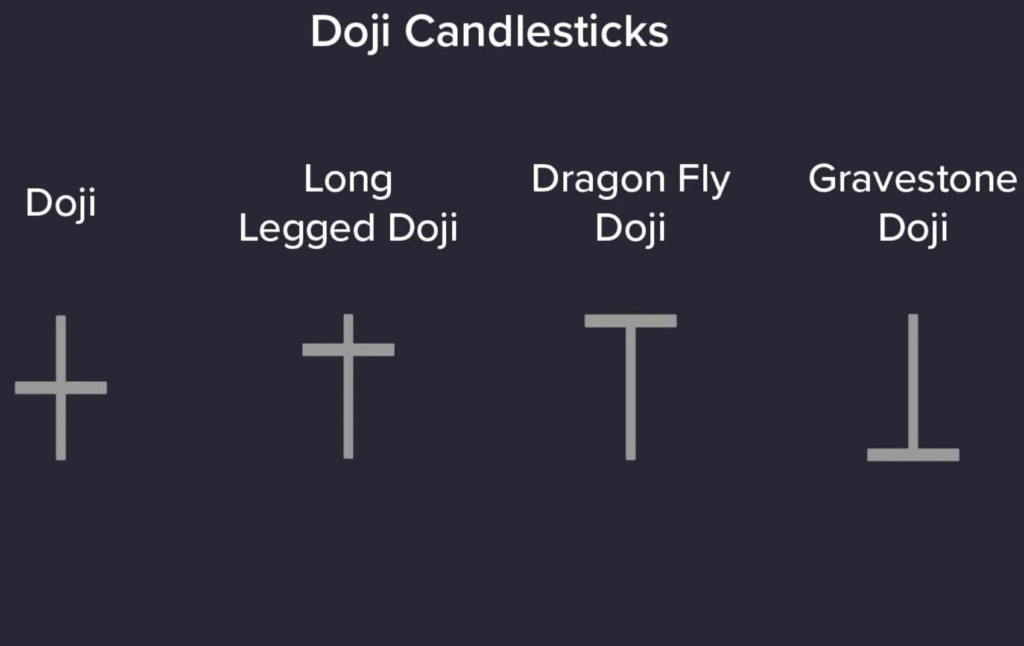
- Doji: A candle with a teeny body (open ≈ close), like the market’s saying, “Uh, I’m confused.” After a big move, it might mean a reversal’s brewing.

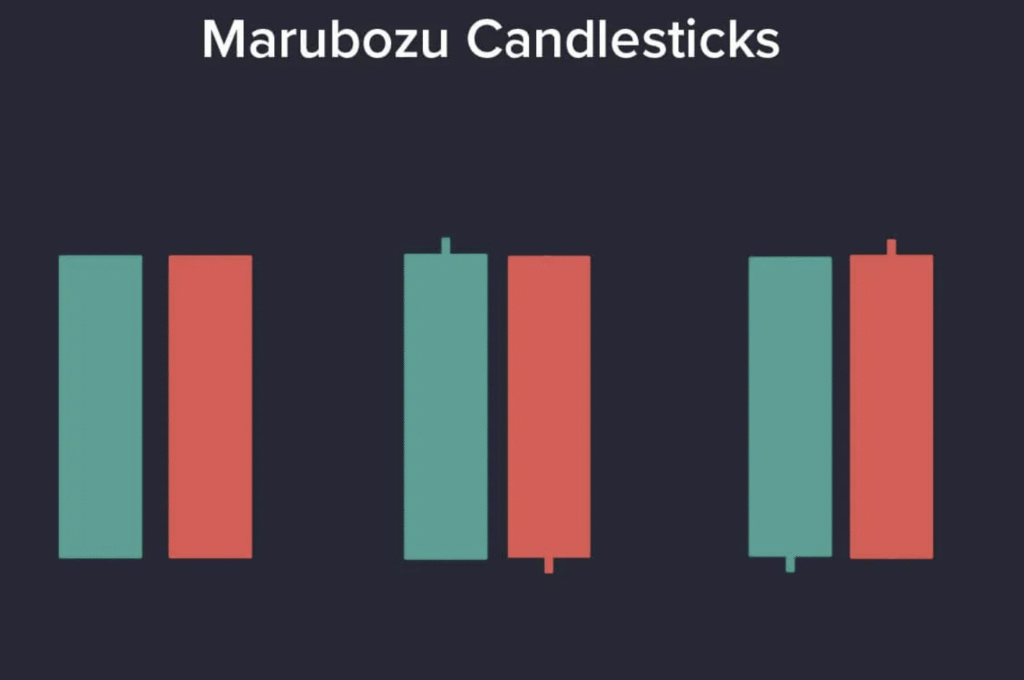
- Marubozu: A bold candle with a long body and no wicks. It screams, “I’m ALL IN!” Green = buyers, red = sellers.

Think of candlesticks as the market’s mood ring. A hammer alone isn’t a buy signal—it’s like seeing one raindrop and grabbing an umbrella. Wait for confirmation (like a green candle the next day) and check the context (is it near support?).
Fun Challenge: Scroll through a chart on Zerodha Kite and hunt for a hammer or doji. Screenshot it and tag us on social media with #ChartWizard! 
Trader’s LOL Moment: Ever see a doji and think the market’s just shrugging like, “I dunno, you figure it out”? 
Trends are the market’s vibe—up, down, or just chilling. Spotting them is like knowing whether to bring sunglasses or an umbrella. 
 There are three types:
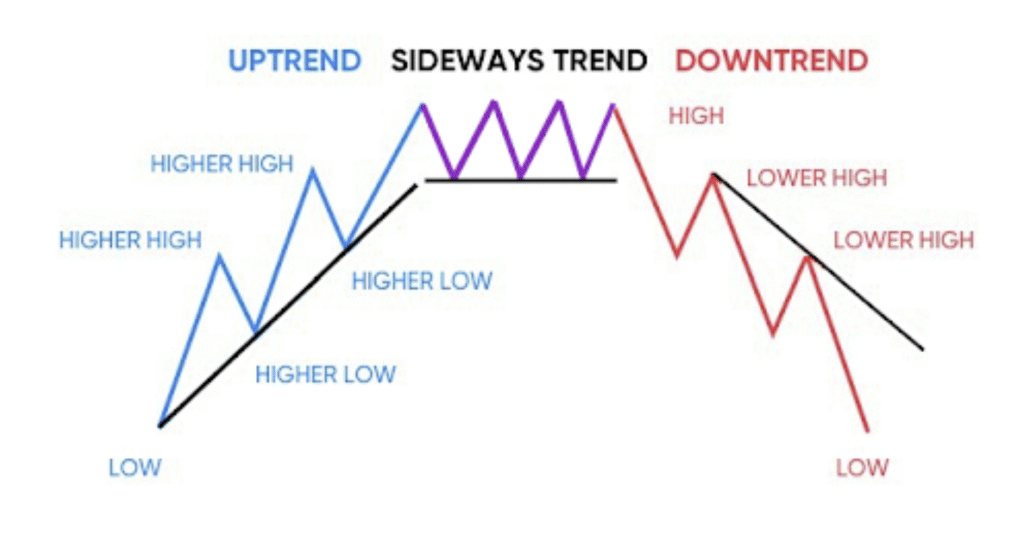
There are three types:- Uptrend: Higher highs and higher lows. The stock’s on a winning streak, like your favorite cricket team.

- Downtrend: Lower highs and lower lows. It’s like the stock’s practicing for the limbo—how low can it go?
- Sideways (Range-Bound): Prices bounce between two levels, like a ping-pong match. No clear winner here.
How to Catch a Trend
- Trendlines: Draw a line connecting higher lows (uptrend) or lower highs (downtrend). It’s like drawing a road map for the price.
- Support & Resistance: Support is the floor where buyers say, “No more falling!” Resistance is the ceiling where sellers yell, “That’s too high!” These levels confirm trends.
- Example: If a stock keeps bouncing off support in an uptrend, it’s like a trampoline for bulls.

- Time Frames: Daily charts show the big picture, while 5-minute charts are for quick day trades. Zoom in and out like a detective!

Interactive Tip: Grab a chart on TradingView, draw a trendline, and share it with us. Did you nail an uptrend or downtrend? Let’s see your skills!
Trader’s LOL Moment: Ever draw a trendline and feel like Picasso, only to realize the stock ignored it completely? Welcome to trading! 
Volume is the number of shares traded, shown as bars below the chart. It’s like the crowd’s cheer at a concert—the louder, the more exciting the show. 
Volume Secrets for Newbies
- High Volume = Big Deal: A price jump with high volume means buyers are pumped (bullish). A drop with high volume? Sellers are in a frenzy (bearish).
- Example: A bullish engulfing with spiking volume is like a rockstar’s encore—trustworthy!
- Low Volume = Meh: Price moves on low volume are like a party with no music—don’t get too excited.
- Volume Spikes: Sudden volume surges often signal big news or breakouts. Keep your eyes peeled!
- Volume Moving Average: Overlay a 10-day SMA on volume to spot “above-average” action. It’s like checking if the crowd’s louder than usual.
Quick Challenge: On Zerodha Kite, add the volume indicator and find a day with a volume spike. What happened to the price? Drop your answer in the comments!
Trader’s LOL Moment: Low volume moves are like your friend whispering, “This is gonna be huge!”… and then nothing happens. 
Popular MAs
- 50-day MA: The medium-term trendsetter. Stock above it? Party’s on! Below it? Time to chill.
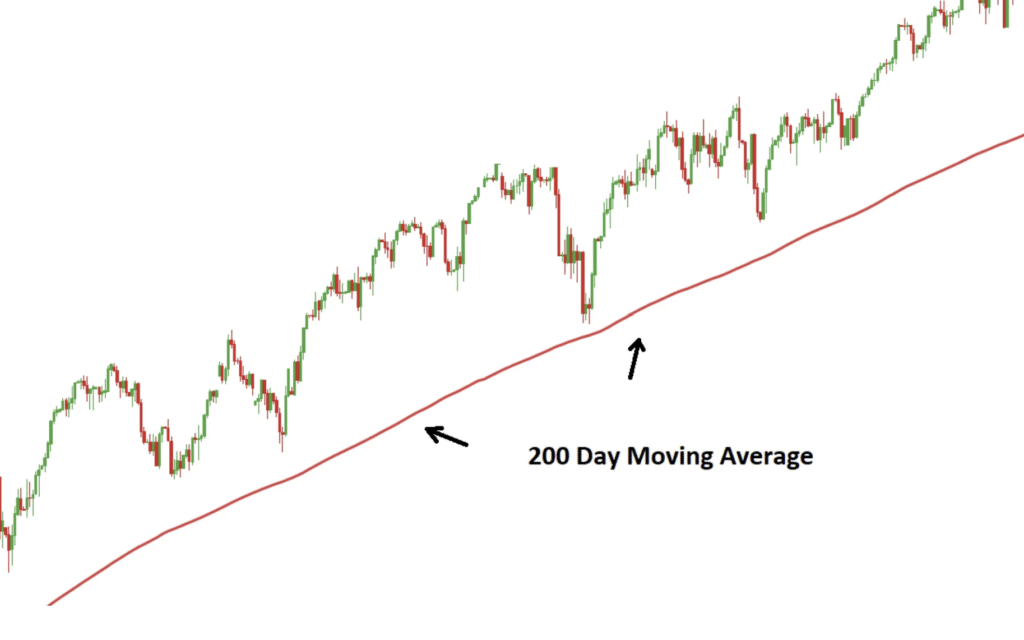
- 200-day MA: The granddaddy of trends. Above it = long-term bullish; below it = bears are napping.
- 9-day or 21-day EMA: Quick and snappy for day traders.
How to Use MAs
- Trend Check: Price above MA = bullish; below = bearish. Easy-peasy.
- Crossovers:
- Golden Cross: Short-term MA (e.g., 50-day) crosses above long-term MA (e.g., 200-day). Bulls are throwing a parade!

- Death Cross: Short-term MA dips below long-term MA. Bears are growling.

- Support/Resistance: MAs can act like price magnets. A stock might bounce off the 50-day MA like it’s a comfy couch.
Interactive Tip: Add a 50-day and 200-day MA on TradingView. Spot a golden cross or death cross on any stock? Share your chart with #MAGuru!
Trader’s LOL Moment: Ever see a golden cross and think you’re about to get rich, only for the stock to yawn and go sideways? The market’s got jokes!


- Get Started: Log into kite.zerodha.com, hit “Chart” (or press “C”), and toggle to TradingView charts in settings. Start exploring!
Fun Challenge: Create a chart on TradingView or Kite with a trendline, MA, and volume. Share it on social media with #StockChartStar. We’ll repost our faves!
Trader’s LOL Moment: Ever zoom out on a chart and realize you’ve been analyzing a 1-minute chart for a week-long trade? Oops! 
- Keep It Simple: Master one pattern (like the hammer) and one indicator (like the 50-day MA) before diving into fancy stuff like Fibonacci retracements. Baby steps, champ!
- Backtest Like a Boss: Use TradingView’s historical data to see if your patterns work. It’s like time-traveling without the DeLorean.
- Checklist Vibes: Before trading, check: Is there a pattern? High volume? Trend alignment? It’s like packing for a trip—don’t forget the essentials.
- Risk Management: Set stop-losses to avoid turning your portfolio into a sad emoji.
 Risk only 1-2% per trade.
 - Learn & Laugh: Follow TradingView’s community or Zerodha Varsity. And when the market trolls you, chuckle and keep learning.
Final Challenge: Pick a stock, analyze it using one tip from this blog, and share your trade idea in the comments. We’ll cheer you on!
Stock charts aren’t rocket science—they’re more like a treasure map, and you’re the pirate with the X-ray vision.  By mastering candlesticks, trends, volume, and moving averages, you’re ready to navigate the market like a pro (or at least fake it ‘til you make it). Tools like TradingView and Zerodha Kite are your trusty crew, making charting fun and accessible. So, grab a chart, spot a hammer, and start your trading adventure. Who knows? Maybe you’ll be the next market legend—or at least have some epic stories to tell!
By mastering candlesticks, trends, volume, and moving averages, you’re ready to navigate the market like a pro (or at least fake it ‘til you make it). Tools like TradingView and Zerodha Kite are your trusty crew, making charting fun and accessible. So, grab a chart, spot a hammer, and start your trading adventure. Who knows? Maybe you’ll be the next market legend—or at least have some epic stories to tell!Got a chart question or a funny trading moment? Drop it in the comments, and let’s keep the convo going! Happy trading, and may your candles always be green! 